Plotting Citi Bike Station Activity with NetworkX & Plotly — NYC & Jersey City
Link to the (Interactive!) Project
Fall 2021
Intro to Urban Data Informatics
Columbia GSAPP
Link to the (Interactive!) Project
Fall 2021
Intro to Urban Data Informatics
Columbia GSAPP
New York’s climate, being continental, receives four distinct seasons spring (March-May), summer (June-August), autumn (September-November), and winter (December-February).
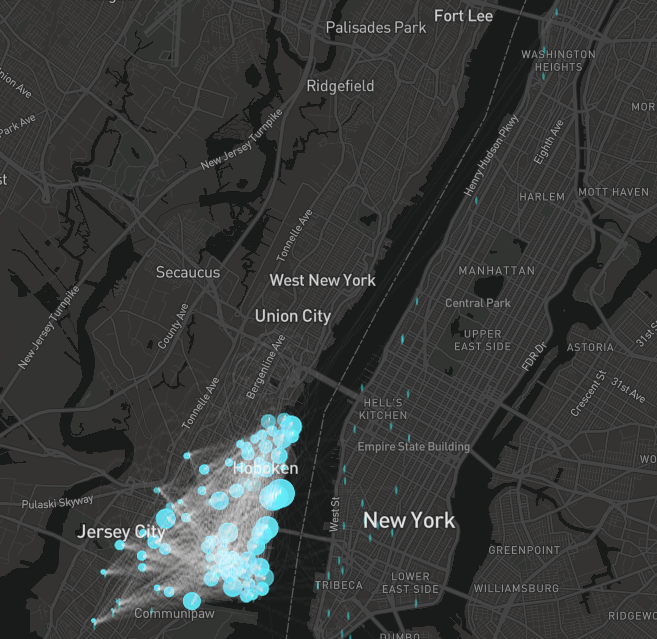
Citi Bikes are a much-loved mode of transport in New York, and the comprehensiveness of the data collected by Citi Bike is every data analyst’s dream come true.
This study attempts to observe the relationship between Citibike ridership with the frequency of use of different nodes to answer the question: “Is there a significant difference in the ridership of Citi Bikes over the seasons?”


Project by Kirthi Balakrishnan | Course by Professor Boyeong Hong